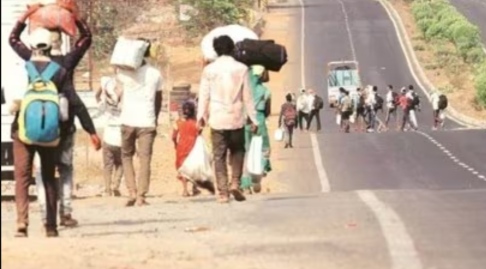
According to MPI poverty rate estimates for 2013-14 and 2022-23, Bihar recorded a 53% decline from 56.3% MPI poverty rate in 2013-14 to 26.59% in 2022-23.
According to a discussion paper released by NITI Aayog on Monday, the proportion of India’s population living in multidimensional poverty is estimated to have come down to 11.28 per cent in 2022-23 from 29.17 per cent in 2013- 2014. In absolute terms, NITI Aayog estimates that a total of 24.82 million people have escaped multidimensional poverty over the past nine years.
States such as Uttar Pradesh, Bihar, Madhya Pradesh and Rajasthan recorded the largest decline in the number of people classified as poor based on the Multidimensional Poverty Index (MPI), which takes into account 12 indicators of different levels of poverty across the three main aspects, which are health, education and standard of living.
The research report also notes that deprivation levels fell at a slightly lower rate between 2015-16 and 2019-21 than between 2005-06 and 2013-14. Deprivation measures the average level of deprivation experienced by a multidimensionally poor person.
At the same time, the pace of deprivation reduction was faster after 2015-2016 in terms of poverty MPI reduction per total population compared to the previous decade, due to a lower number of years. In 2005-06, the proportion of MPI poor in the total Indian population was 55.34%. The discussion paper uses previously published MPI data based on the National Family Health Survey (NFHS) conducted in 2015-15 and 2019-21, which also uses NFHS-3 data from 2005-06 to understand long-term poverty trends.
Based on these three NFHS datasets, NITI Aayog has estimated poverty MPI rates for the years 2013-14 and 2022-23 with technical inputs from the Oxford Policy and Human Development Initiative (OPHI) and United Nations Development Program (UNDP).
The discussion paper was released by Prof. Ramesh Chand, Member NITI Aayog in the presence of CEO NITI Aayog BVR Subrahmanyam.
Professor Chand noted that without the impact of the coronavirus pandemic, the MPI poverty rate in 2022-23 would have been much less. The article also notes that it “may not fully reflect the impact of Covid on the economy,” as some of the NHFS-5 data collected from 2019 to 2021 was collected before the pandemic . BVR Subrahmanyam added that India has the potential to achieve target 1.2 of the Sustainable Development Goals (SDGs), which calls for reducing “by at least half the proportion of men, women and children of all ages living in poverty.” poverty in all aspects according to national standards”. definitions”. before 2030.
According to the document, living standards indicators showed the highest levels of deprivation in 2005-06. For example, 74.4% of the population suffered from cooking fuel shortage in 2005-06, this number decreased to 58.47% in 2015-16 and then to 43.9% in 2019-16. 21. Similarly, 70.92% of the population did not have adequate sanitation during 2005-06, which decreased to 51.88% in 2015-16 and then to 30.93% during 2019-2021.
The sharpest decline between the two periods was recorded by the index measuring lack of access to a bank account, which fell to 9.66% in 2013-14 from 58.11% in 2005-06. According to MPI poverty rate estimates for 2013-14 and 2022-23, Bihar recorded a 53% decline from 56.3% MPI poverty rate in 2013-14 to 26.59% in 2022-23. Jharkhand also recorded a 50% decline from 47.13% in the MPI poverty rate to 23.34%. Uttar Pradesh, which had a lower MPI poverty rate in 2022-23 than Bihar, Jharkhand and Meghalaya, recorded a decline to 17.4 per cent from 42.59 per cent in 2013-14.
India’s definition of multidimensional poverty is measured using 12 indicators, including nutrition, child and adolescent mortality, maternal health, years of schooling, school attendance, safe drinking water safety, electricity, housing and property. The MPI seeks to measure poverty more comprehensively rather than relying solely on income levels to assess deprivation.
For more information, visit at https://happenrecently.com/zepto/?amp=1

